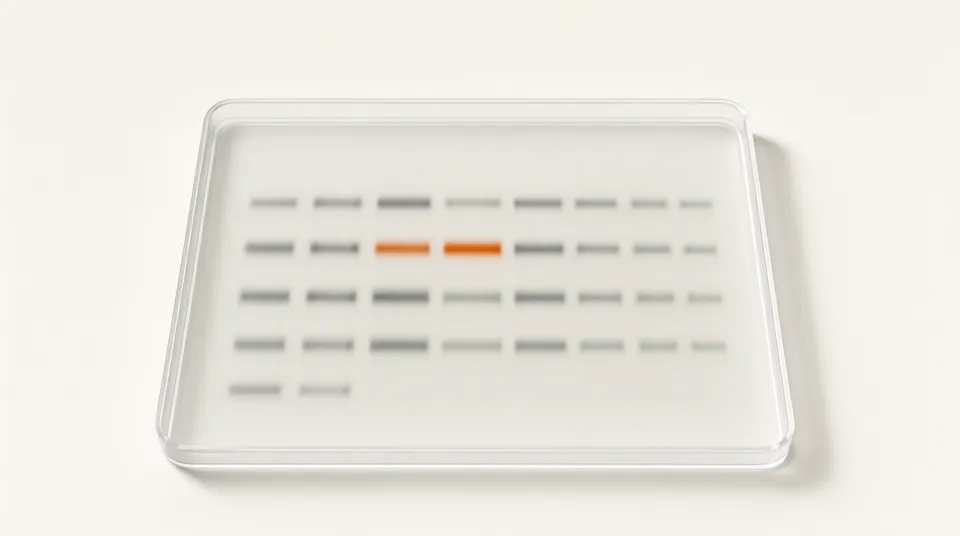
About this experiment
Load several DNA fragment mixtures into a gel and follow their separation. Use the size ladder as a measurement reference rather than reading hidden sample labels. Compare polarity, run time and gel concentration, then examine why closely spaced fragments can overlap or leave the gel.
Learning goals
- Relate smaller DNA fragments to farther forward migration.
- Estimate fragment size from a log-size ladder calibration.
- Investigate polarity, excessive run time and limited band separation.
How to use it
- 1Load the selected lane with comma-separated fragment sizes and switch on power.
- 2Run for thirty modeled minutes and compare sample bands with the ladder.
- 3Load unknown samples, click a sample band and inspect the ladder-based size estimate.
- 4Compare reversed polarity, higher gel concentration and a longer run, recording bands that leave the gel.
The model
Assumptions
- DNA is negatively charged and moves toward the positive electrode. The gel is 8 cm long with wells at 0.6 cm; the selected voltage is normalized to a 100 V reference.
- Band position uses a prescribed linear relation with log10 base-pair count, voltage, time and gel concentration raised to 0.8. This calibration is illustrative rather than an experimental protocol prediction.
- Band spread is a Gaussian width estimate increasing with time. Intensities are false-color markers without a DNA-mass model. Size estimation fits position against log size using at least two visible ladder bands; off-gel bands are excluded, and interpolation is restricted to the visible ladder range.
Try this in class
- Q1Why can very similar fragment sizes remain unresolved despite different exact positions?
- Q2Why can a longer run reduce the usefulness of the size ladder?
Frequently asked questions
Are the hidden sample sizes guessed by an AI model?
No. A deterministic regression uses known visible ladder sizes and their positions.
Why does size estimation disappear before running or after all ladder bands leave?
Zero migration gives no size-dependent slope, and fewer than two visible reference bands cannot define the calibration.