About this experiment
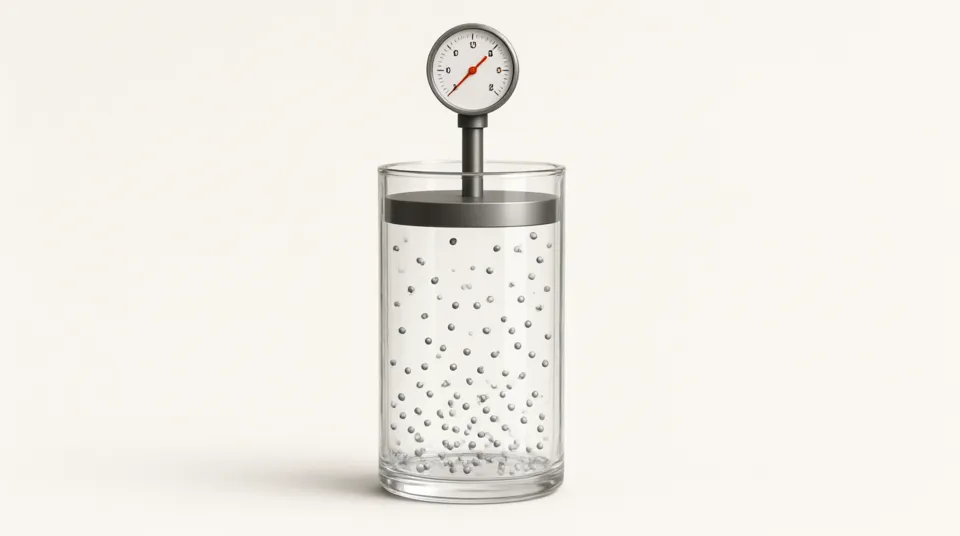
Explore the pressure-volume relationship of an ideal gas in a cylinder. In constant-temperature mode, move the piston to trace an isotherm. Switch to constant-volume mode to heat or cool the gas along a vertical line on the pressure-volume diagram. The dots indicate the amount of gas schematically; this is an equilibrium calculation rather than a molecular collision simulation.
Learning goals
- Apply the ideal gas equation with consistent pressure and volume units
- Verify Boyle law at constant temperature and amount of gas
- Compare isothermal and constant-volume changes on a pressure-volume graph
How to use it
- 1At 300 K and 1 mol, read the pressure at 20 L.
- 2In constant-temperature mode, halve the volume and compare the pressure and PV product.
- 3Switch to constant-volume mode. Double the temperature and compare P/T.
- 4Change the amount of gas while holding volume and temperature unchanged. Predict and check the pressure ratio.
The model
Assumptions
- The gas is ideal, with negligible molecular volume and no intermolecular forces.
- Every displayed state is uniform thermal and mechanical equilibrium. Transient heating and piston acceleration are ignored.
- Pressure is absolute, temperature is in kelvin, and 1 kPa L equals 1 J.
- Changing the amount of gas selects a new equilibrium comparison; it does not simulate an injection process.
Try this in class
- Q1What pressure should 1 mol at 300 K exert in a 20 L container?
- Q2Why must temperature be measured in kelvin when comparing pressure ratios?
- Q3Which process has a vertical path on the pressure-volume graph, and why?
Frequently asked questions
Why does pressure rise when volume decreases?
At fixed temperature and amount of gas, the ideal gas equation gives P = nRT/V. Halving the volume therefore doubles the pressure.
Why can only one of the temperature and volume sliders move?
The selected process holds one variable fixed. Switching the process keeps the current equilibrium state and changes which variable is adjustable.