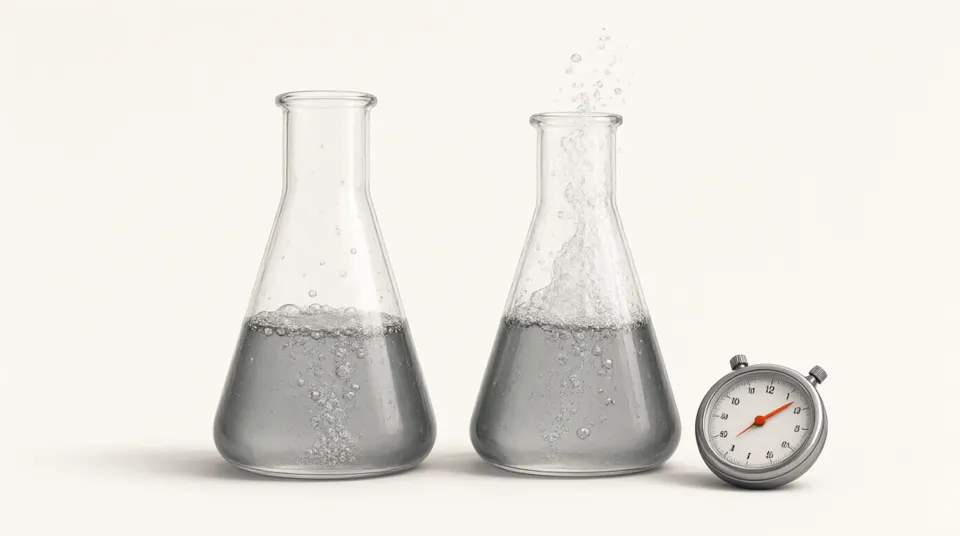
About this experiment
Molecules can only react when they collide, and most collisions are too gentle to break bonds. In this box, blue A molecules and violet B molecules fly around and bounce off each other. When an A hits a B hard enough, with at least the activation energy along the line between their centres, they turn into green products. Raise the concentration, the temperature or add a catalyst, and watch how the number of products grows faster for different reasons.
Learning goals
- Explain that particles must collide with at least the activation energy to react
- Explain why a higher concentration increases the rate: more collisions per second
- Explain why a higher temperature increases the rate mainly because a larger share of collisions has enough energy
- Describe how a catalyst gives a route with a lower activation energy
- Read a reaction rate from the gradient of a products against time graph
How to use it
- 1Press Run with the default settings. Watch the graph of products formed. Is it steepest at the start or at the end? Why?
- 2Raise the concentration to 70 molecules each. Compare the new line with the dashed line from the last run.
- 3Go back to 40 molecules and raise the temperature to 400 K. Look at the energy histogram: how much of it lies to the right of Ea now?
- 4Compare the share of successful A-B collisions with the prediction e^(-Ea/RT) at 300 K and at 400 K.
- 5Set the temperature back to 300 K and raise the activation energy to 10 kJ/mol. What happens to the initial rate?
- 6Switch on the catalyst. Which line in the energy chart moves, and does the histogram itself change?
The model
Assumptions
- Molecules are hard discs of equal mass moving in two dimensions. Collisions with each other and with the walls are perfectly elastic.
- A collision between an A and a B reacts when the kinetic energy of the relative motion along the line of centres is at least Ea. The products carry on with the same velocities, so energy is conserved and the reaction neither gives out nor takes in heat.
- The catalyst halves the activation energy. It is not drawn as a surface; it only changes the energy needed to react.
- Every run starts from the same seeded positions and speeds, so the same settings always give the same result. With so few molecules the measured share of successful collisions scatters around the prediction.
- Energies are in kJ/mol and time is in arbitrary units of the model.
Try this in class
- Q1Why does the products graph get less steep as time goes on?
- Q2Doubling the number of both A and B molecules makes A-B collisions about four times as frequent. Why four and not two?
- Q3A catalyst is not used up in a reaction. Why does it still make the reaction faster?
- Q4Why do food and medicines keep longer in a fridge?
- Q5Powdered magnesium reacts faster with acid than a magnesium ribbon. Which idea from collision theory explains this?
Frequently asked questions
Why is the energy distribution not the same shape as the bell curve in the textbook?
In two dimensions the share of molecules with energy E falls off exponentially, so the curve has its highest point at zero. In three dimensions the curve starts at zero, rises and then falls. The tail beyond Ea behaves the same way in both cases, and that tail is what matters for the rate.
Does a catalyst give the molecules more energy?
No. The histogram stays the same when you add the catalyst. Only the activation energy line moves to the left, so more of the collisions that already happen are energetic enough to react.
Is the reaction rate the same as the speed of the molecules?
No. The rate counts how many molecules react per second. Faster molecules collide a little more often, but the main effect of temperature is that many more collisions have enough energy.
Why does the share of successful collisions not exactly match the prediction?
There are only a few hundred collisions between A and B in a run, so the count has random scatter, just as a real experiment would. With more molecules and longer runs the measured share gets closer to e^(-Ea/RT).