About this experiment
Build an offspring generation one gene copy at a time. Compare eight reproducible populations and investigate how breeding size affects random fixation and loss without adding any fitness advantage.
Learning goals
- Distinguish random genetic drift from viability selection.
- Relate diploid population size to the number of sampled gene copies.
- Recognize fixation and loss as absorbing states without mutation or migration.
How to use it
- 1Draw one gene copy and inspect the partial offspring container.
- 2Complete the next generation and compare its frequency with the parent.
- 3Run several generations and compare all eight replicate curves.
- 4Repeat with a smaller breeding population and a new sampling seed.
The model
Assumptions
- Each discrete generation contains N diploid organisms represented by 2N gene copies. Offspring copies are independent draws with replacement from the parent frequency.
- There is no selection, mutation or migration. Frequencies of zero and one remain fixed.
- The starting A count is the nearest integer to target frequency times 2N. Readouts report the actual initial frequency after rounding.
- Partial offspring draws are visible but do not update the completed-generation frequency until all 2N copies are sampled.
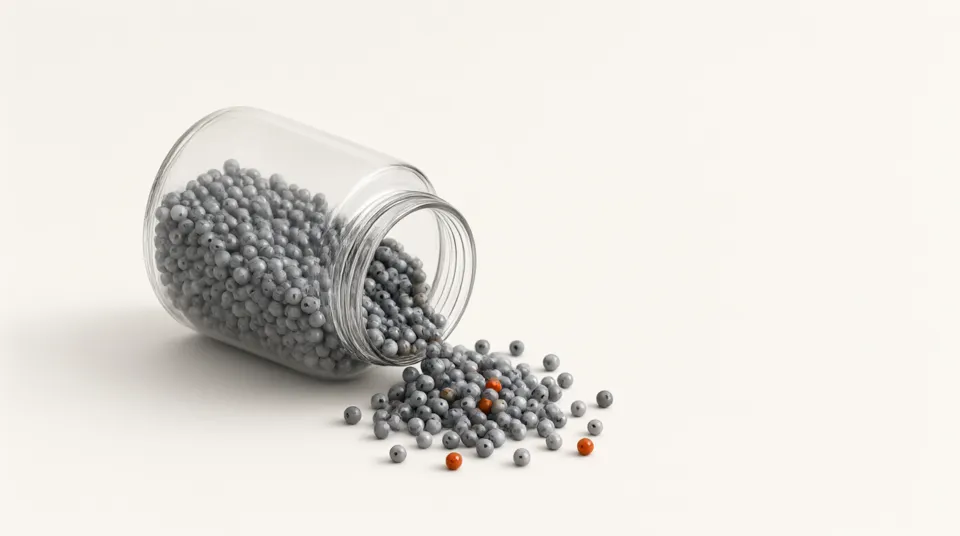
- Each replicate uses a different deterministic seed. The same settings, seed and replicate reproduce exactly the same sequence. Beads are symbolic gene copies, not spatial organisms.
Try this in class
- Q1Why does removing a sampled parental bead give the wrong model?
- Q2Can one replicate increase while another decreases with identical initial settings?
Frequently asked questions
Why is the initial frequency sometimes different from the target?
A finite population has an integer number of A copies. Rounding to the nearest available count produces the reported actual frequency.
Why does the completed frequency stay unchanged during partial sampling?
The next generation is not complete until all 2N offspring gene copies have been drawn.