About this experiment
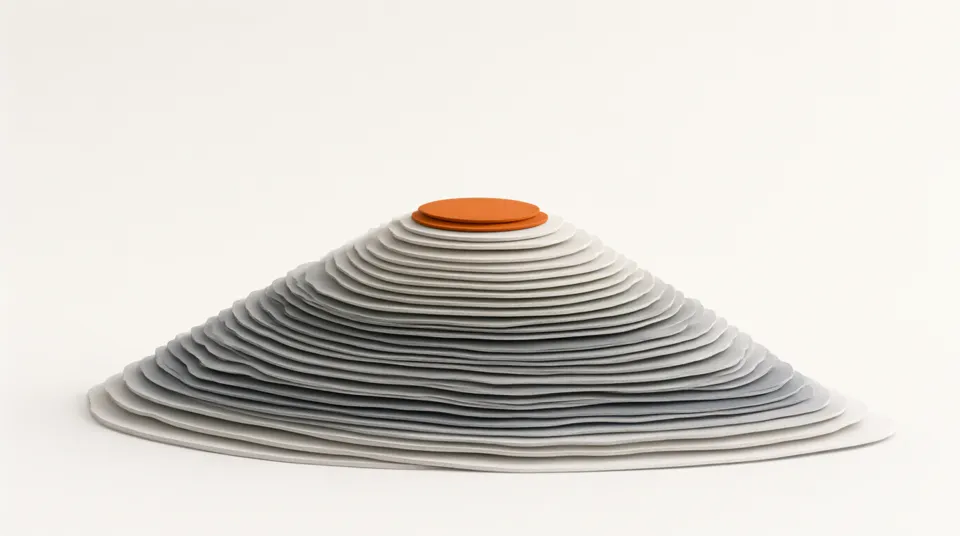
A contour line joins places that are the same height above sea level. Reading contours lets you see hills, valleys and cliffs on a flat map. Here the same landscape is shown twice: as a 3D model you can turn, and as a contour map. Choose a landform, drag the hills around the map, change the contour interval and flood the land to see that every contour is the shoreline the sea would have at that height.
Learning goals
- Explain what a contour line and a contour interval are
- Read the height of a point from a contour map
- Recognise a hill, a valley, a saddle and a steep slope from the pattern of contours
- Relate the spacing of contours to the steepness of the ground
- Explain why contour lines never cross and always close into loops
How to use it
- 1Start with Hill. Turn the 3D model and compare it with the map. Which side of the hill is steeper, and how can you tell from the map?
- 2Move the cursor over the map and read the height and slope. Find the steepest place.
- 3Raise the sea level slowly. Watch the blue shoreline: it follows the contour at the same height.
- 4Choose Two peaks. Find the saddle between the summits. What do the contours look like there?
- 5Choose Valley. Contours bend where they cross a valley. Which way does the V of the contours point: uphill or downhill?
- 6Drag one hill on top of another and watch the contours merge. Then change the interval from 50 m to 25 m.
The model
Assumptions
- The map covers 10 km by 10 km and the land is at least 40 m above sea level until you flood it.
- The terrain is made from smooth Gaussian bumps, so there are no sharp cliffs, rivers or buildings.
- The 3D model is stretched upwards so the hills are easy to see. Real hills of this size would look much flatter.
- Every fifth contour is drawn thicker and labelled, as on most topographic maps.
Try this in class
- Q1Two hikers climb the same hill from opposite sides. One route crosses contours that are close together. Which route is harder?
- Q2Why can two contour lines never cross each other?
- Q3On a map with a 10 m contour interval, a path crosses 7 contour lines going uphill. How much height does it gain?
- Q4Why do contour lines form a V where they cross a river valley?
- Q5A town is planning where to build homes that will be safe if sea level rises by 1 m. How could a contour map help?
Frequently asked questions
What is the difference between a contour interval and a scale?
The scale tells you how distances on the map compare with distances on the ground. The contour interval tells you the height difference between neighbouring contour lines.
How do I tell a hill from a hollow?
Read the height labels. If the numbers rise towards the middle of the rings, it is a hill. If they fall, it is a hollow. Many maps add small tick marks on the downhill side of a hollow.
Why do some maps use colour as well as contours?
Colour bands, called layer tints, give a quick overall picture of high and low ground, while the contours give the exact heights.