About this experiment
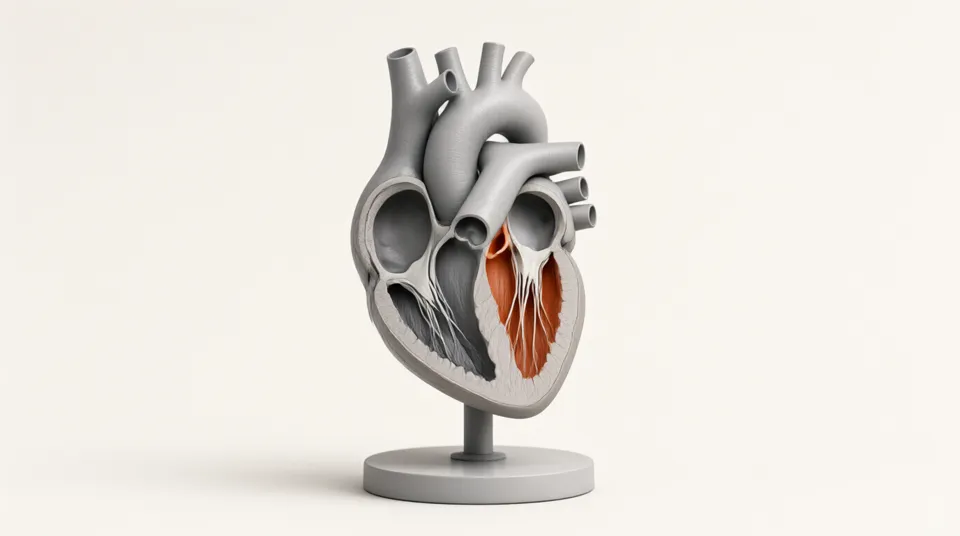
Your heart beats about 100,000 times a day without a rest. Each beat is a careful sequence: the atria squeeze, the ventricles contract, four valves open and shut at exactly the right moments, and the familiar lub-dub sound is made by valves snapping closed. Watch the beating heart in slow motion next to an ECG and a chart of the valves, change the heart rate from sleeping to running, and work out how much blood the heart pumps.
Learning goals
- Name the four chambers, the four valves and the main blood vessels of the heart
- Trace the path of blood through the heart, lungs and body
- Describe the stages of the cardiac cycle and when each valve is open
- Explain what causes the two heart sounds
- Calculate cardiac output from heart rate and stroke volume
How to use it
- 1Use slow motion and follow the blue blood from the vena cava to the pulmonary artery. Then follow the red blood from the pulmonary veins to the aorta.
- 2Watch the valve chart. Are the valves between atria and ventricles ever open at the same time as the valves into the arteries? Why not?
- 3Switch on the sound. Which valves closing make the lub, and which make the dub?
- 4Find the moment of the tall spike on the ECG. What does the heart do just after it?
- 5Change from Resting to Running. Which gets shorter, the time the ventricles contract or the time they relax?
- 6Calculate the cardiac output at rest and when running. Check your answers with the readout.
The model
Assumptions
- Ventricular contraction lasts 0.16 s + 0.2 × the beat length, about 0.32 s at 75 beats per minute; diastole takes the rest of the beat. Atrial contraction lasts 0.1 s.
- The ventricles fill to about 80 % before the atria contract, and the atria add the last 20 %. The volume curve shows this shape and is not a measurement.
- The ECG is a simplified trace made of P, Q, R, S and T waves timed to the mechanical events.
- Stroke volume is set with its own slider. In a real body it changes with exercise, posture and fitness.
- Both sides of the heart beat together and pump the same volume.
Try this in class
- Q1Put these in the order blood passes through them: aorta, left atrium, lungs, right ventricle, vena cava, left ventricle, pulmonary artery, right atrium.
- Q2Why is the wall of the left ventricle thicker than the wall of the right ventricle?
- Q3A heart beats 75 times a minute with a stroke volume of 70 mL. What is the cardiac output in litres per minute?
- Q4What job do the valves do? What would happen if the mitral valve leaked?
- Q5Why does the heart rate go up during exercise?
Frequently asked questions
Why is the right side of the heart drawn on the left?
Diagrams show the heart as you would see it in a person facing you, so their right side is on your left. Doctors and textbooks all use this view.
What makes the heart beat?
A small group of cells in the right atrium, the sinoatrial node or natural pacemaker, sends an electrical signal about once a second. The signal spreads across the atria, pauses briefly at the atrioventricular node so the ventricles can fill, then spreads through the ventricles. The ECG records these electrical signals.
Is blood without oxygen really blue?
No, it is dark red. Diagrams use blue for blood low in oxygen and red for blood rich in oxygen so the two circuits are easy to tell apart. Veins look bluish through the skin because of how light passes through skin.